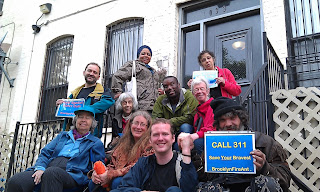
20130512


INFO=WALK May 11 2013 News Video & Photos/some

News12 Brooklyn TimeWarner


20130511


Walk Against FDNY Cuts - Saturday May 11, 2013

Walk Against FDNY Cuts - Saturday May 11, 2013


Rallies and Reflections - throughout the day

ROUTE and TIMES – Brooklyn, NY

http://BrooklynFireAnt.blogspot.com

10th Annual – DEDICATIONS
2012 SANDY Victims and Responders
+900+ Rana Factory Victims --- Bangladesh 04-24-2013
62 Myanmarese – Thai Refugee camp...03-23-2013
241 – Kiss disco – Brazil...01-17-2013
117 – Tazreen factory – Bangladesh...11-24-2012
289 – Ali factory – Pakistan...09-11-2012
146 – Triangle ShirtWaist Factory Fire...1911

2012=58 New Yorkers Died in Fires

FACTS...

NYC MAYOR COULD CLOSE A FIRE COMPANY PROTECTING

YOUR Self, Family, Pets, Workplace 

Take Action NOW

 call 311 and say... Don't Cut My Fire Company

call City Council and say ... Don’t Cut My Fire Company

NYC.gov and Find Your Community Board

HOLD A RALLY AT LOCAL FIREHOUSE


            Forum 9am     Engine278 (closed 2003) - 5011 7th Ave. /51st Street 11220
                        ++++   FDNY Budgets: emergencies, health/housing, poverty

            Forum 10am   Red Hook Houses East - 93 Centre Street/Clinton St. 11231
                        ++++   Hurricane Sandy…Red Hook, preparation/response


            Forum 11am   Engine204 (closed 2003) - 299 DeGraw Street/Court St. 11231
                        ++++   Workplace Fatalities


            LUNCH 11:30am


                                   FDNY, health, housing, arson/victims, and public/workplace safety


            Forum 2pm     Fatal Arson Mom+2kids and Woman - 1033 Pacific St./Classon St. 11238
                        ++++   FDNY Budgets: emergencies, health/housing, poverty

            Forum 330pm Engine209 (closed 2003) - 850 Bedford Ave./Myrtle Ave. 11205
                        ++++   FDNY Budgets: emergencies, health/housing, poverty


            TENTATIVE as of 5/9/13

            Forum 415pm Engine271 - 392 Himrod St./Wyckoff Ave. 11237
                        ++++   FDNY Budgets: emergencies, health/housing, poverty

            Forum 5pm     Engine212/Foam91/People's Firehouse - 136 Wythe Ave./North 9th St. 11211
                        ++++   FDNY Budgets: emergencies, health/housing, poverty


We appreciate your interest and participation to support NYC employees and services that protect
life, health, pets, homes, property and commerce.
Sincerely,
Brooklyn FireAnt
Florida FireAnt
__

20130510


2012 BUREAU OF FIRE INVESTIGATION – BFI 2012

xxx


http://www.nyc.gov/html/fdny/pdf/publications/bfi_annual_rep/2012/2012_annual_final.pdf
Noting that the 2012 BFI does not refer to Superstorm Sandy, these are some highlights:

                                                FIRE FATALITIES <2007 – 2012> NYC #440
                                                                Bronx                      85           19%
                                                                Brooklyn                142         32%=HIGHEST FIRE FATALITIES 2007 – 2012
                                                                Manhattan             86           20%
                                                                Queens                 98           22%
                                                                Staten Is.               29           7%

FIRE FATALITIES 2012 – NYC #58
RACE/ETHNICITY – AfricanAmerican►21…36% +Hispanic►14…7% = TOTAL#37…64%
STRUCTURE – Multiple Dwelling Residential►32…55% ▬▬ Commercial+MD/PD Dwelling = TOTAL#53…91%
                AGE – 01-19►4…7% – LaborForce20-59►25…43% – 60-90+►29…50%
                GENDER – Female►24…41% – Male►34…59%
                Cause Electrical                                  ►15…26%
                Smoke Detector NOT Working         ►10…17%
                Fire Season – Jan.►11 + Feb.►12 +Dec.►8 = TOTAL#31…53%
                Time – hourMid►7 +hour5am►7 = TOTAL#14…12% ▬▬ Day Tour►17…29% – Night Tour►41…71%

FIRE FATALITIES                  Bronx                      18           31%                                CB08      4              7%
                                            Brooklyn                 16           28%                                  CB01      3              5%
                                            Manhattan               9              16%                                CB12      2              3%
                                            Queens                 12           21%                                   CB12      3              5%
                                            Staten Is.                 3              5%                                  CB01      2              3%.
                                            TOTAL                    58                                                    TOTAL    14           14%

                                                FIRE INJURIES <2007 – 2012> NYC #4894
                                                                Bronx                    1027       21%
                                                                Brooklyn               1460       30%=HIGHEST FIRE INJURIES 2007 – 2012
                                                                Manhattan             1058       22%
                                                                Queens                 1123       23%
                                                                Staten Is.               226         5%

FIRE INJURIES 2012 – NYC #853
                RACE/ETHNICITY – AfricanAmerican►224…29% +Hispanic►257…30% = TOTAL#501…59%
                STRUCTURE – Multiple Dwelling Residential552…61% ▬▬ Commercial+MD/PD Dwelling = TOTAL #794…93%
                                AGE – 01‑19►152…18% –  LaborForce20‑59421…49%  – 60‑90+►180…21% – Unknown►100…12%
                                GENDER – Female►445…52% – Male►406…48%
                                Cause Electrical                                  294…34%
                                Smoke Detector NOT Working         112…13%
                                Fire Season – Jan.►68 + Feb.►108 +Dec.►76 = TOTAL#252…30%
                                Fire Season – Jan.►68 + Feb.►108 +Dec.►76 +Nov.►91 = TOTAL #343…40%
                                Time – hourNoon►62 +hour9pm►57 = TOTAL#119…14% ▬▬ Day Tour►334…39% – Night Tour►519…61%

FIRE INJURIES          Bronx                    186         22%                                        CB05      29           3%
                                Brooklyn          199         23%=Highest                                CB04      23           3%
                                Manhattan       219         26%                                              CB03      27           3%
                                Queens           218         26%                                              CB12      37           4%
                                Staten Is.         31           4%                                                CB01      19           2%
                                TOTAL             853                                                              TOTAL    135         16%


ACCIDENTAL FIRES – ALL NYC #2619 – Brooklyn #864 +Queens #620 = TOTAL #1347…51%

ACCIDENTAL FIRES                 Bronx                    483         18%                                     CB12      78           3%
                                                Brooklyn                864         33%=Highest                       CB05      78           3%
                                                Manhattan             514         20%                                     CB08      57           2%
                                                Queens                 620         24%                                     CB12      96           4%
                                                Staten Is.               138         5%                                       CB01      67           3%
                                                TOTAL                    2619                                                  TOTAL    376         14%

BFI 2012 DOES NOT MENTION SANDY’S IMPACT ON FDNY RESPONSES OR FIRES (example Breezy Point).
Compared 2012 and 2011:


Structural
Occupied Building
Structural
Vacant Building
Structural

SubTotal
Auto & Transit
Other
TOTAL

Accidental Fires
BFI 2012 Sandy?
2361
20
2381
100
138
2619
-2321
-19
-2340
-105
-124
-2569
CHANGE Sandy?
40
1
41
-5
14
50


INCENDIARY – Arson FIRES – ALL NYC #1947 ▬▬ BFI TOTAL ARRESTS #453

ARSON  BOROUGH                                                          OCCUPIED BUILDING                                      OCCUPIED BUILDING
                Bronx                    484         25%                     Bronx                    348       29%                      CB01      70           6%
                Brooklyn                688         35%=Highest       Brooklyn              416        34%=Highest        CB05      45           4%
                Manhattan             323         17%                     Manhattan           248        21%                       CB11      59           5%
                Queens                 338         17%                     Queens               143        12%                       CB12      30           2%
                Staten Is.               114         6%                       Staten Is.               53        4%                         CB01      35           3%
                TOTAL                   1947                                   TOTAL               1208       62%                        TOTAL    239         20%


xxx

20130508


NYC Council Hearing 2013-03-07 - Council Members Fire Committee


This page is powered by Blogger. Isn't yours?